Tiffany Henschel
Graphic Designer + Design Researcher


Time is Water is a multimedia exploration into water as an indication of time in the Taleggio Valley (BG, Italy). The project studies the effects of water as they relate to growth, decay, subjectivity, and personal bias through various visualizations and interfaces.
Inspired by a plastic bag found during a hike that had essentially turned into the shape of a rock through years of impact with rushing water, these studies hope to enhance our understanding of water as a precious, powerful, yet finite resource rather than omnipresent and perpetual, even in a region where it is seemingly abundant.
This project was initiated as part of NAHR, a month-long interdisciplinary residency in Sottochiesa, a village in the Taleggio Valley, Northern Italy. An eco-related theme is chosen each year. Water (acqua) was the theme of 2018.
Process

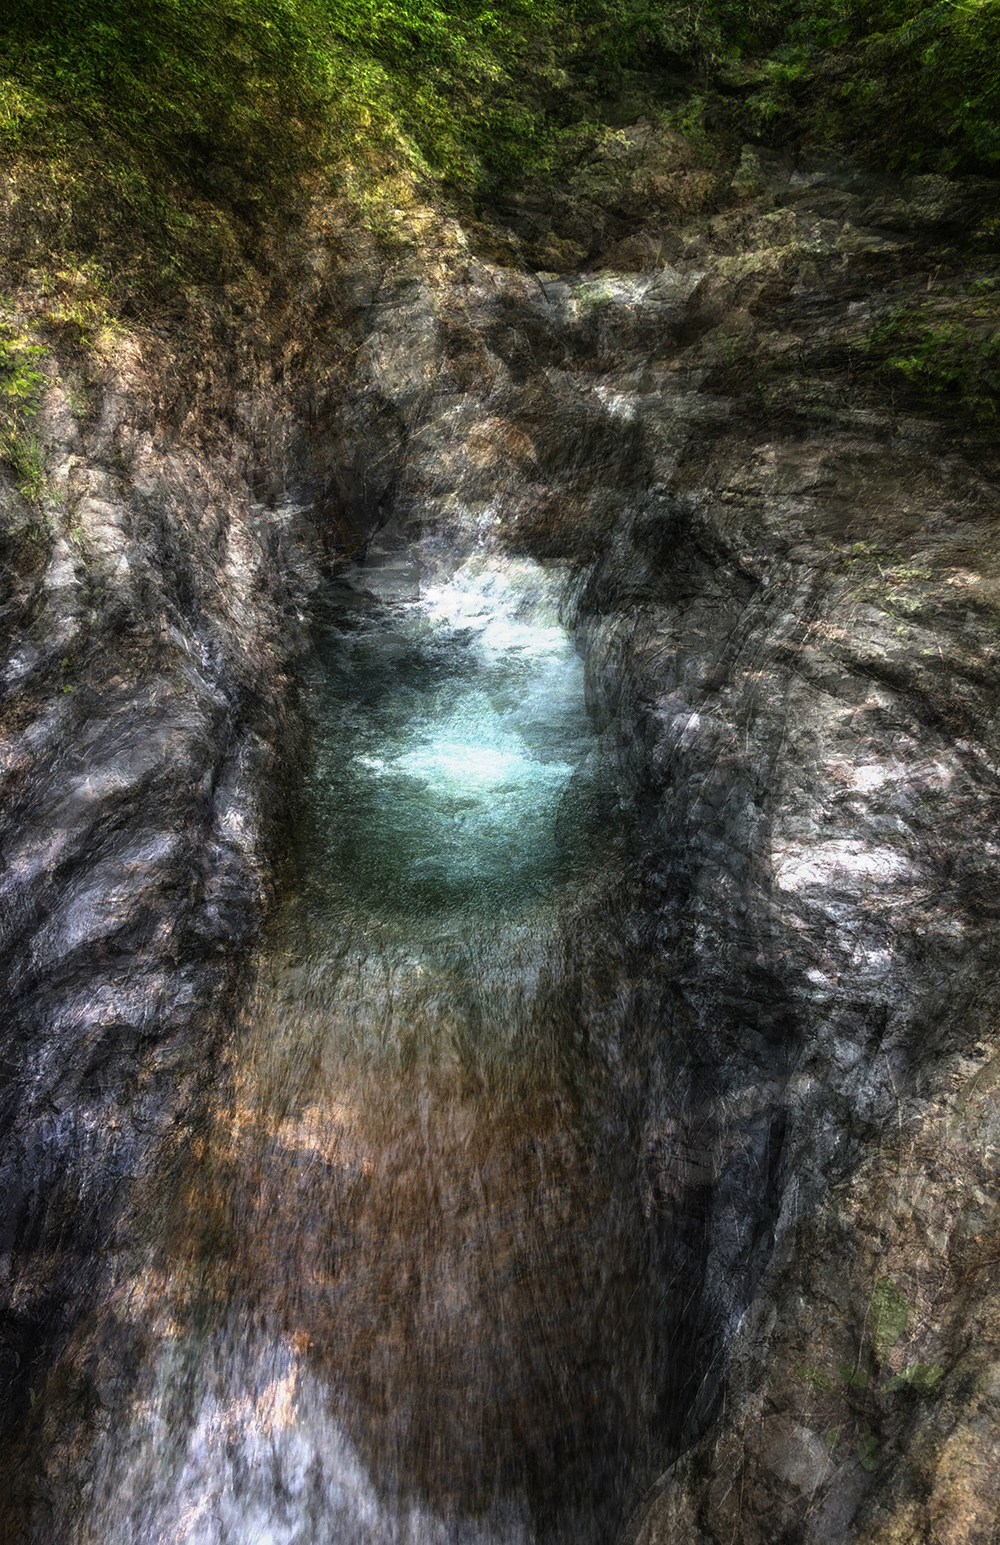
Grotta di Partigliano

The tumbled “rock”
Found at the bottom of the Grotto Waterfall, an area I learned later was a hiding site from the SS during World War II.

Exploration
Initial research consisted of multiple geotagged hikes throughout the valley. The town is situated on a steep hill on the southern edge of a W-shaped valley, and most of the curved roads meet up with one another at some point, making for a daily stroll that could be made short or long, one where I could wander but not get lost.

Number analysis
After a week of exploration, I identified coordinates that were geotagged the most
and thought about why that was. Three themes emerged with one thing in common: time is water, and water is time.
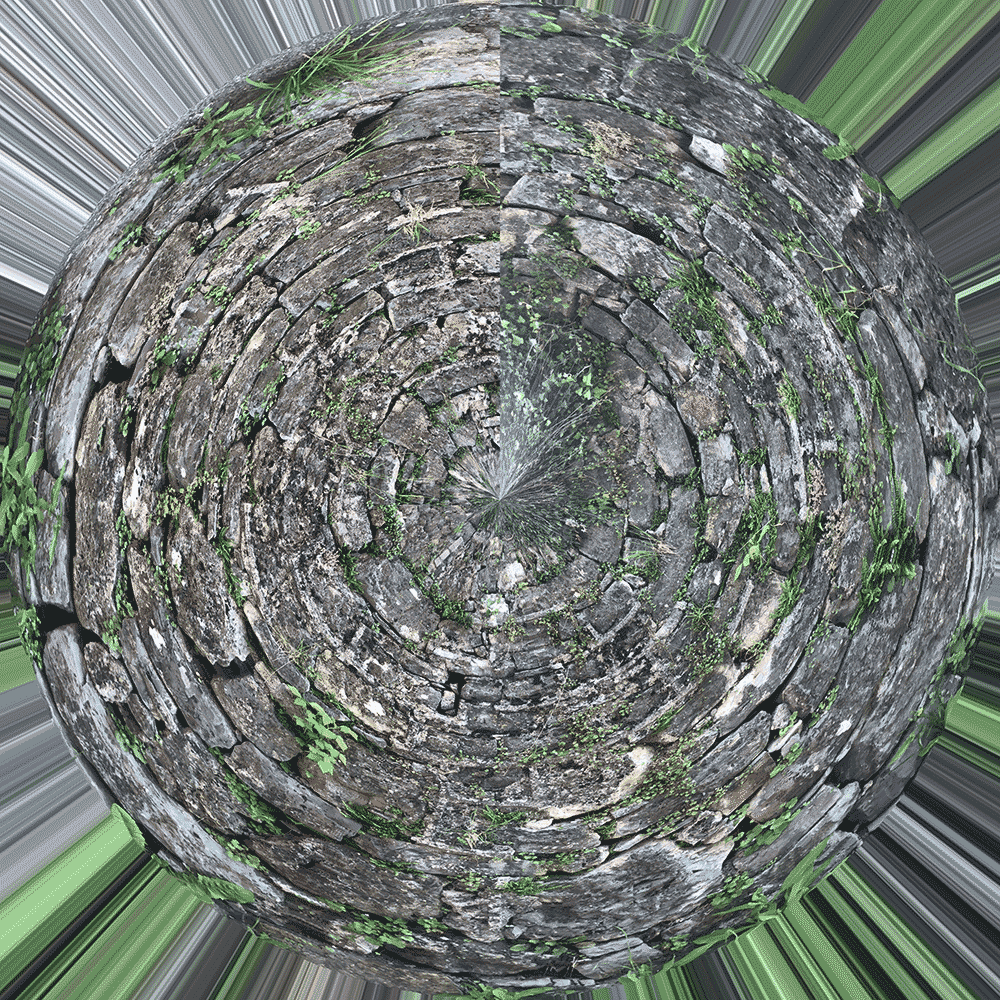
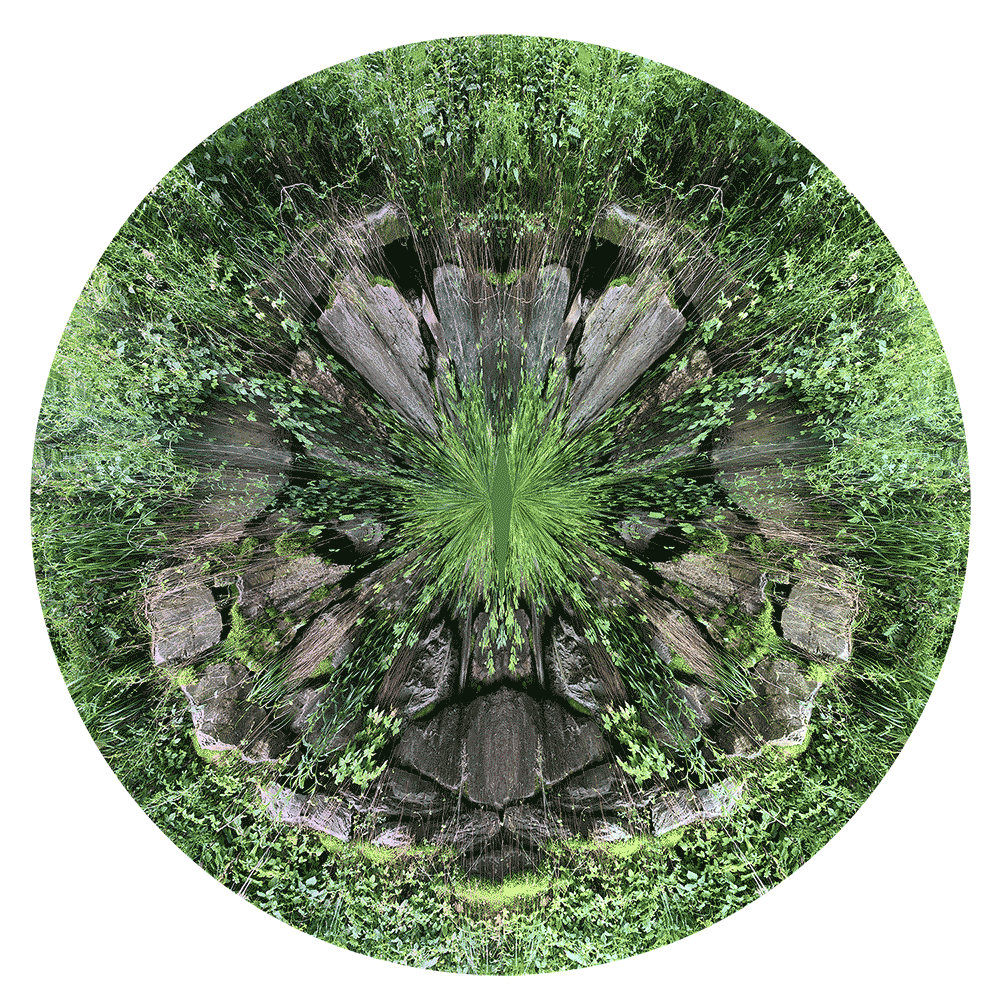
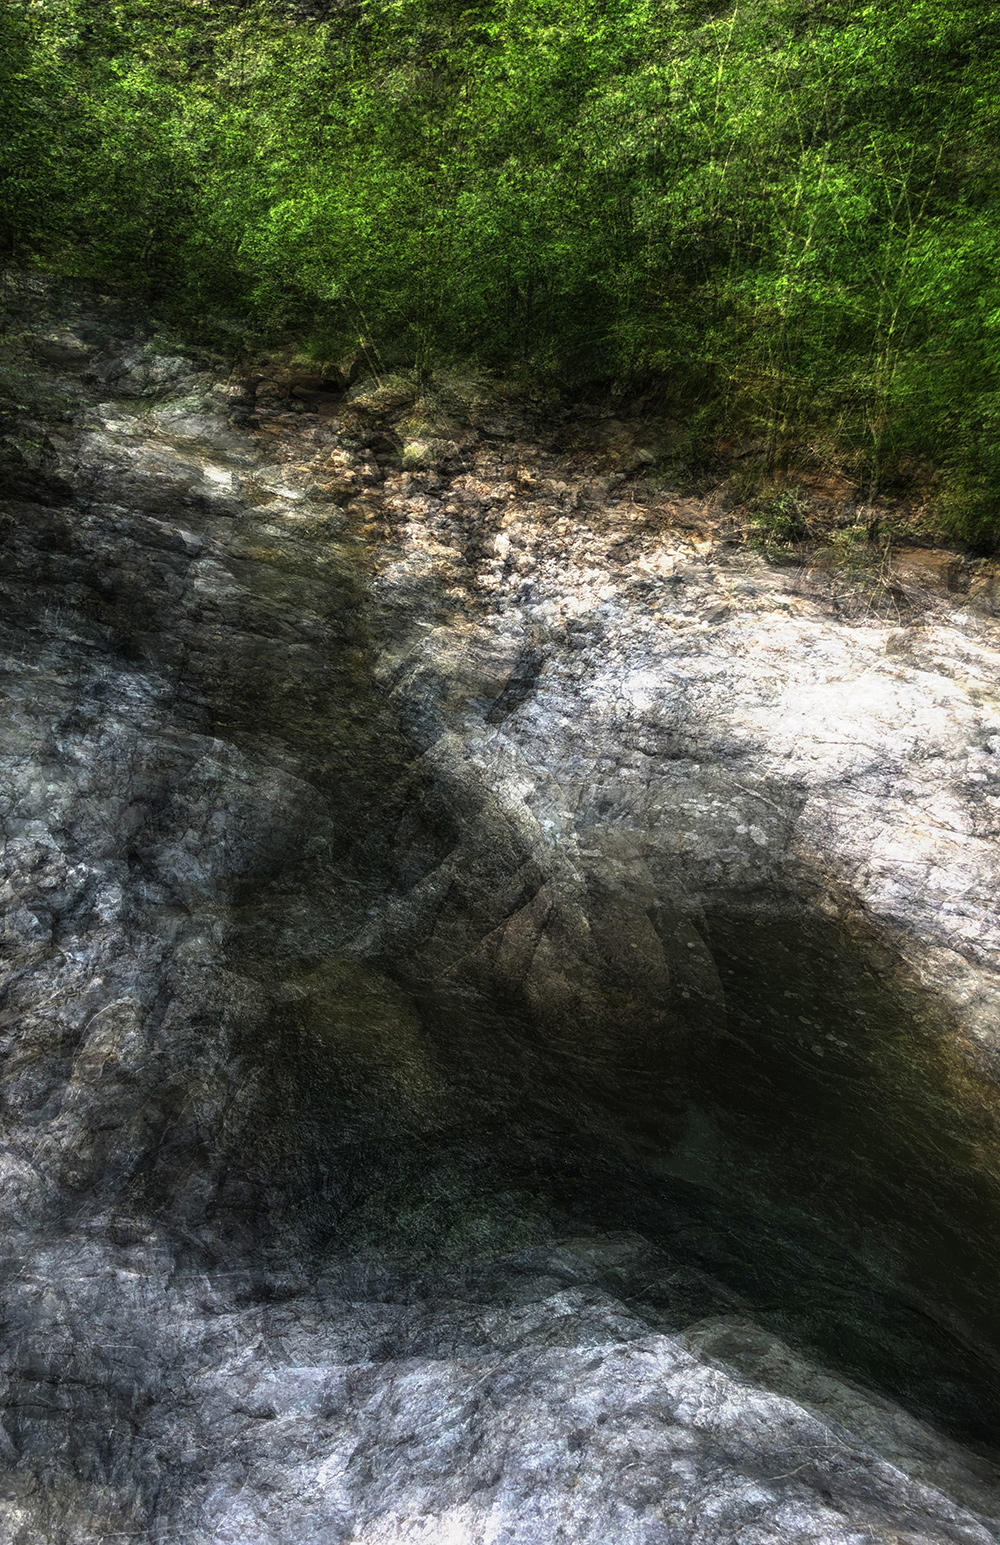
Theme One: Rock walls
Why was I so attracted to these rock walls? Besides the beauty of their construction, each one had a life of its own. I was disappointed to often see pieces of refuse pushed into the cracks and crevices. How could looking at these walls as micro-environments, tiny worlds in and of themselves, change how people treated them? I explored color palettes of the walls, lined up several panoramics, and turned them into spheres to identify them as worldly planets.

Color Palettes
Color variations were observed using both 256 and 16 colors.. From far away most of the rocks appear to be brown, but brown hues are just a piece of the rock walls’ color palette.

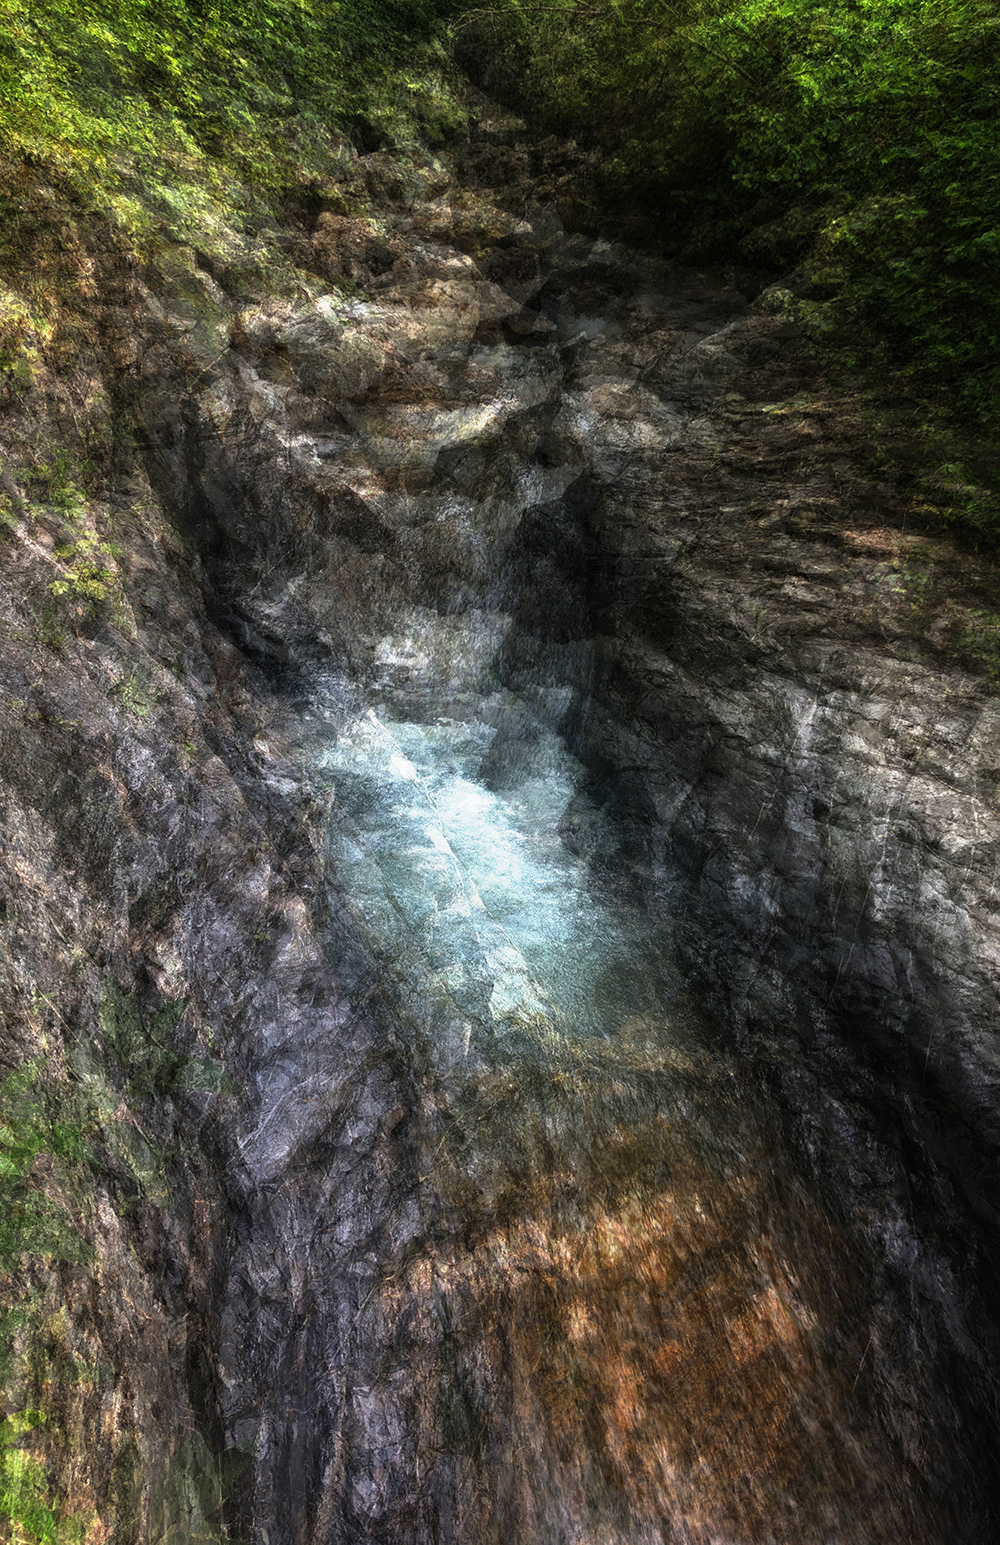
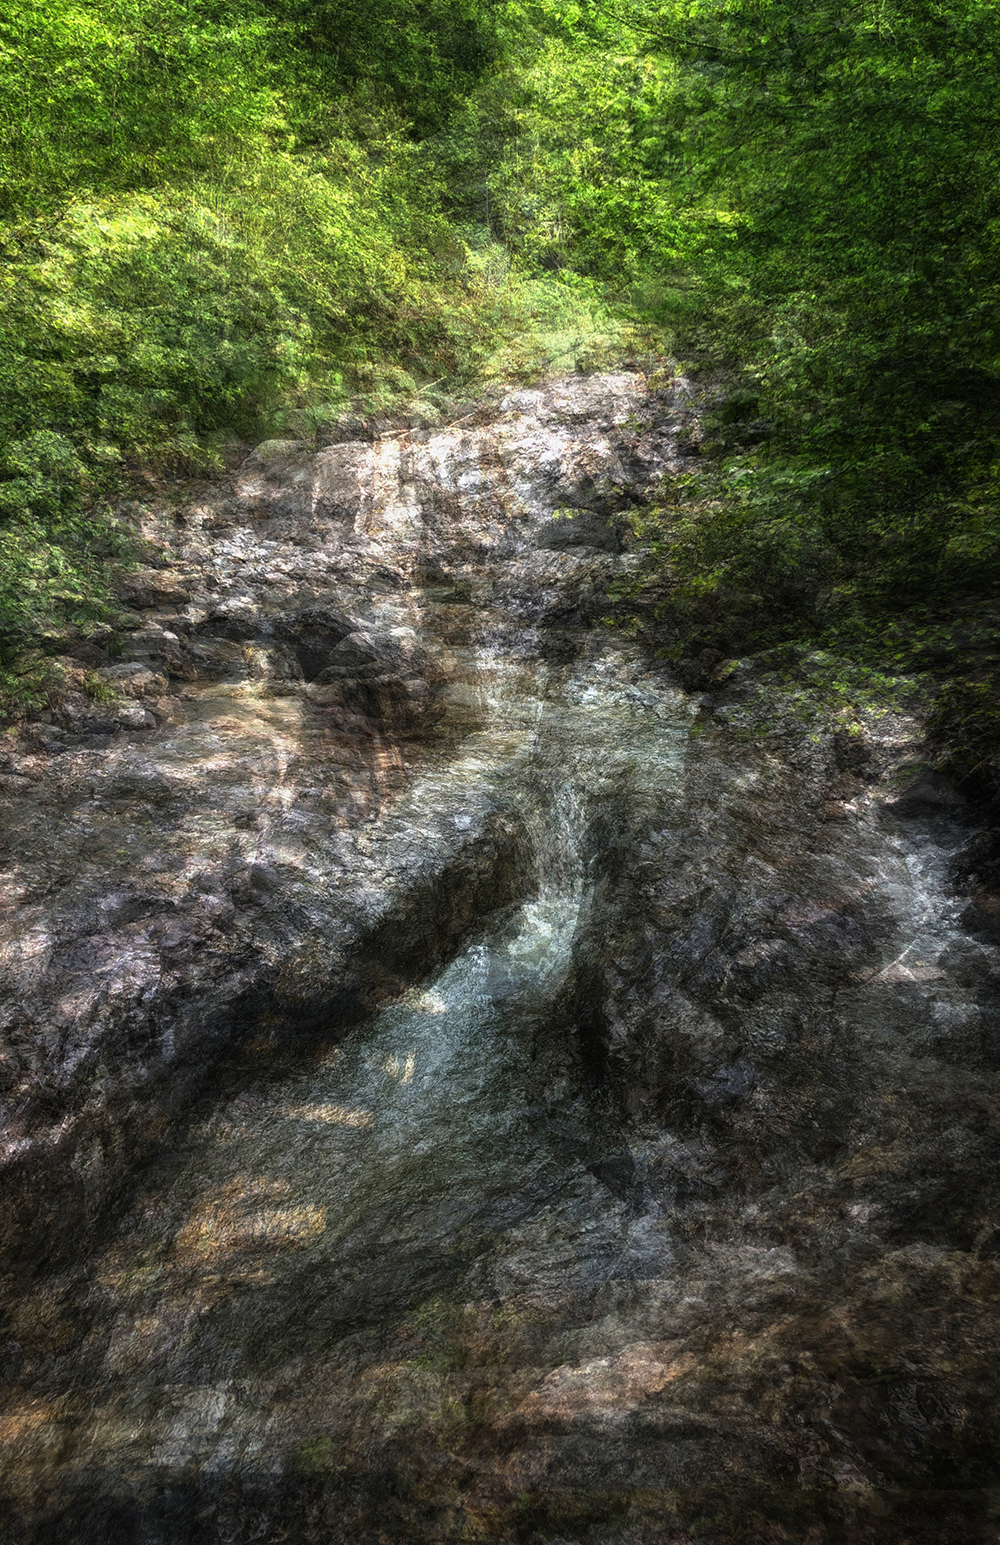
Theme Two: Gesture drawings as data
This investigation was based on two questions: how can water be an indication of time, and how can we look at time differently by studying water? Each day at 8:30 in the morning I walked to the same river entrance down the road. I established four views of the river from different angles. Then, I created four drawings for five days in a row of the same four views. I also recorded 10-second videos and one photo of each gesture drawing. I layered them in various ways using different techniques in an attempt to be mindful of my perspective, my position, angle, and mood.

Each of the twenty days is displayed here. Each column depicts one view, days 1-5.


The photos were layered on top of one another to visualize my different perspectives despite an attempt to remain consistent location and angles throughout each day.
Theme Three: Decaying Cigarettes
For multiple days in a row I collected cigarette butts of varying levels of decay along SR25 in between Marta’s and the entrance to the river (about 200 meters). I was surprised how many there still were after the third day on the same route, even with the erosion of frequent rain. Cellulose acetate in the filter mimics cotton and takes years to decompose.


Conclusions
-How can internal factors affect our perception on something that appears unchanged over time? How can these things change day to day, without us knowing?
-What is data in this context? Are my gesture drawings data? Ethnographic and qualitative analysis?
Not a lot of documentation or map presence in this area - it’s not even on wikipedia, and the river I visited daily isn’t on most maps. It took me going to a local merchant and asking for its name.
-Water and time can indicate one another in various ways
-What does immersion mean? How long does it take to get to know an area, and how can this method/approach be used as a method of field research?
Update: Even six months later I can look at these photos and listen to sound samples and almost be immersed in the space once again. Multimedia documentation and an acknowledgement of subjectivity and bias can help deepen the immersion and research experience.